Best Google Analytics 4 Alternatives (2026)
Short answer: PostHog is the best Google Analytics 4 alternative in our benchmark, scoring 56/60 against Google Analytics 4's 36/60 - the gap is driven mainly by session replay & qualitative insight, Google Analytics 4's weakest scored criterion relative to PostHog.
Last tested 2026-09-22 · same benchmark as the full Best Product Analytics Tools ranking
Why people look for Google Analytics 4 alternatives
People search for GA4 alternatives once they need to actually understand in-product user behavior - session replay, precise funnels, feature flags - rather than top-of-funnel traffic and marketing attribution, which is what GA4 is built for. Here's how the alternatives compare on product-analytics depth, including PostHog, which scored highest while still offering a genuinely usable free tier.
Full ranking, Google Analytics 4 included
Open-source product analytics platform that bundles event tracking, session replay, feature flags, and A/B testing in one self-hostable product.
- Event Tracking & Setup Simplicity
- 9/10
- Funnel & Retention Analysis Depth
- 8/10
- Session Replay & Qualitative Insight
- 9/10
- Experimentation & Feature Flags
- 10/10
- Pricing Transparency & Cost at Scale
- 10/10
- Data Ownership & Warehouse Export
- 10/10
Event-based product analytics platform built around fast, self-serve funnel and retention analysis.
- Event Tracking & Setup Simplicity
- 8/10
- Funnel & Retention Analysis Depth
- 9/10
- Session Replay & Qualitative Insight
- 6/10
- Experimentation & Feature Flags
- 7/10
- Pricing Transparency & Cost at Scale
- 8/10
- Data Ownership & Warehouse Export
- 6/10
Enterprise product intelligence platform unifying behavioral analytics, experimentation, and a customer data platform.
- Event Tracking & Setup Simplicity
- 7/10
- Funnel & Retention Analysis Depth
- 10/10
- Session Replay & Qualitative Insight
- 7/10
- Experimentation & Feature Flags
- 9/10
- Pricing Transparency & Cost at Scale
- 4/10
- Data Ownership & Warehouse Export
- 6/10
Experimentation-first analytics platform built around feature flags and statistically rigorous A/B testing, with product analytics included.
- Event Tracking & Setup Simplicity
- 7/10
- Funnel & Retention Analysis Depth
- 6/10
- Session Replay & Qualitative Insight
- 3/10
- Experimentation & Feature Flags
- 10/10
- Pricing Transparency & Cost at Scale
- 9/10
- Data Ownership & Warehouse Export
- 6/10
Auto-capture product analytics tool that records every user interaction automatically, no manual event instrumentation required.
- Event Tracking & Setup Simplicity
- 10/10
- Funnel & Retention Analysis Depth
- 7/10
- Session Replay & Qualitative Insight
- 8/10
- Experimentation & Feature Flags
- 5/10
- Pricing Transparency & Cost at Scale
- 3/10
- Data Ownership & Warehouse Export
- 5/10
Budget-friendly heatmap and session recording tool built primarily for understanding website visitor behavior.
- Event Tracking & Setup Simplicity
- 9/10
- Funnel & Retention Analysis Depth
- 4/10
- Session Replay & Qualitative Insight
- 8/10
- Experimentation & Feature Flags
- 2/10
- Pricing Transparency & Cost at Scale
- 9/10
- Data Ownership & Warehouse Export
- 5/10
Free, ubiquitous web analytics platform with basic funnel reporting layered on top of marketing-first traffic analytics.
- Event Tracking & Setup Simplicity
- 9/10
- Funnel & Retention Analysis Depth
- 5/10
- Session Replay & Qualitative Insight
- 2/10
- Experimentation & Feature Flags
- 4/10
- Pricing Transparency & Cost at Scale
- 10/10
- Data Ownership & Warehouse Export
- 6/10
Product-led growth platform combining analytics with in-app guides, onboarding flows, and NPS surveys.
- Event Tracking & Setup Simplicity
- 7/10
- Funnel & Retention Analysis Depth
- 7/10
- Session Replay & Qualitative Insight
- 7/10
- Experimentation & Feature Flags
- 6/10
- Pricing Transparency & Cost at Scale
- 3/10
- Data Ownership & Warehouse Export
- 5/10
Digital experience analytics platform built around best-in-class session replay and heatmaps, with product analytics layered on top.
- Event Tracking & Setup Simplicity
- 7/10
- Funnel & Retention Analysis Depth
- 6/10
- Session Replay & Qualitative Insight
- 10/10
- Experimentation & Feature Flags
- 3/10
- Pricing Transparency & Cost at Scale
- 3/10
- Data Ownership & Warehouse Export
- 5/10
| Rank | Tool | Event Tracking & Setup Simplicity | Funnel & Retention Analysis Depth | Session Replay & Qualitative Insight | Experimentation & Feature Flags | Pricing Transparency & Cost at Scale | Data Ownership & Warehouse Export | Score |
|---|---|---|---|---|---|---|---|---|
| #1 | PostHogWinner Open-source product analytics platform that bundles event tracking, session replay, feature flags, and A/B testing in one self-hostable product. | 9/10 | 8/10 | 9/10 | 10/10 | 10/10 | 10/10 | 56/60 |
| #2 | Mixpanel Event-based product analytics platform built around fast, self-serve funnel and retention analysis. | 8/10 | 9/10 | 6/10 | 7/10 | 8/10 | 6/10 | 44/60 |
| #3 | Amplitude Enterprise product intelligence platform unifying behavioral analytics, experimentation, and a customer data platform. | 7/10 | 10/10 | 7/10 | 9/10 | 4/10 | 6/10 | 43/60 |
| #4 | Statsig Experimentation-first analytics platform built around feature flags and statistically rigorous A/B testing, with product analytics included. | 7/10 | 6/10 | 3/10 | 10/10 | 9/10 | 6/10 | 41/60 |
| #5 | Heap Auto-capture product analytics tool that records every user interaction automatically, no manual event instrumentation required. | 10/10 | 7/10 | 8/10 | 5/10 | 3/10 | 5/10 | 38/60 |
| #6 | Hotjar Budget-friendly heatmap and session recording tool built primarily for understanding website visitor behavior. | 9/10 | 4/10 | 8/10 | 2/10 | 9/10 | 5/10 | 37/60 |
| #7 | Google Analytics 4 Free, ubiquitous web analytics platform with basic funnel reporting layered on top of marketing-first traffic analytics. | 9/10 | 5/10 | 2/10 | 4/10 | 10/10 | 6/10 | 36/60 |
| #8 | Pendo Product-led growth platform combining analytics with in-app guides, onboarding flows, and NPS surveys. | 7/10 | 7/10 | 7/10 | 6/10 | 3/10 | 5/10 | 35/60 |
| #9 | FullStory Digital experience analytics platform built around best-in-class session replay and heatmaps, with product analytics layered on top. | 7/10 | 6/10 | 10/10 | 3/10 | 3/10 | 5/10 | 34/60 |
Alternatives reviewed
Starting with the top-ranked alternative, then every other option we tested.
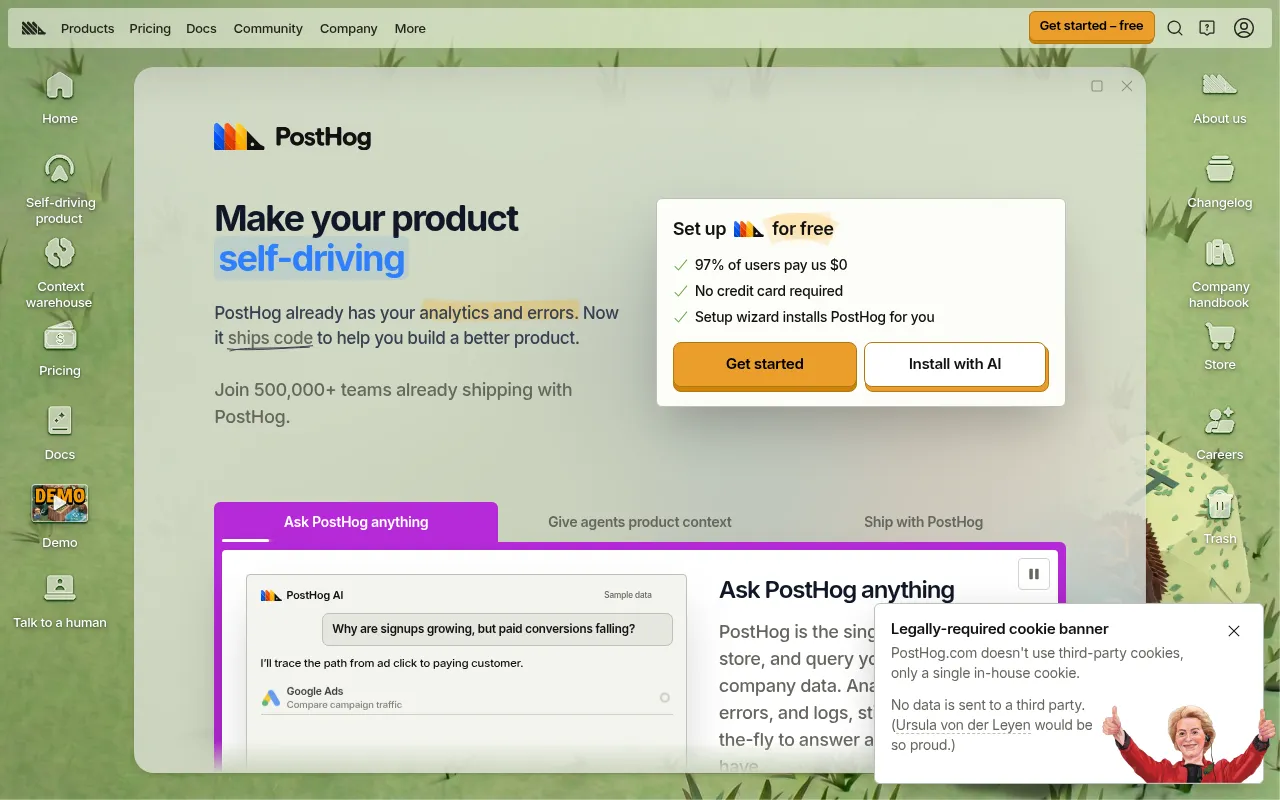
PostHog
WinnerOpen-source product analytics platform that bundles event tracking, session replay, feature flags, and A/B testing in one self-hostable product.
Strengths
- +Only tool tested that bundles analytics, session replay, feature flags, and experimentation natively
- +Fully open-source and self-hostable, so data never has to leave your own infrastructure
- +Published, self-serve pricing calculator - no sales call required to estimate cost at scale
Weaknesses
- -Per-product metered pricing gets harder to predict once you're using several features at once
- -Less polished, less beginner-friendly UI than Mixpanel or Amplitude
Heads up: PostHog prices every product (analytics, replay, flags, experiments) separately. Turning on all four is powerful, but your bill is now four usage-based line items to track instead of one - budget time to actually read the pricing calculator before committing.
Free up to 1 million events per month on the hosted cloud plan (unlimited on self-hosted); paid usage is metered per product - analytics, replay, flags, experiments - rather than one bundled seat price, so cost scales with how many of its tools you actually turn on.
Visit PostHog →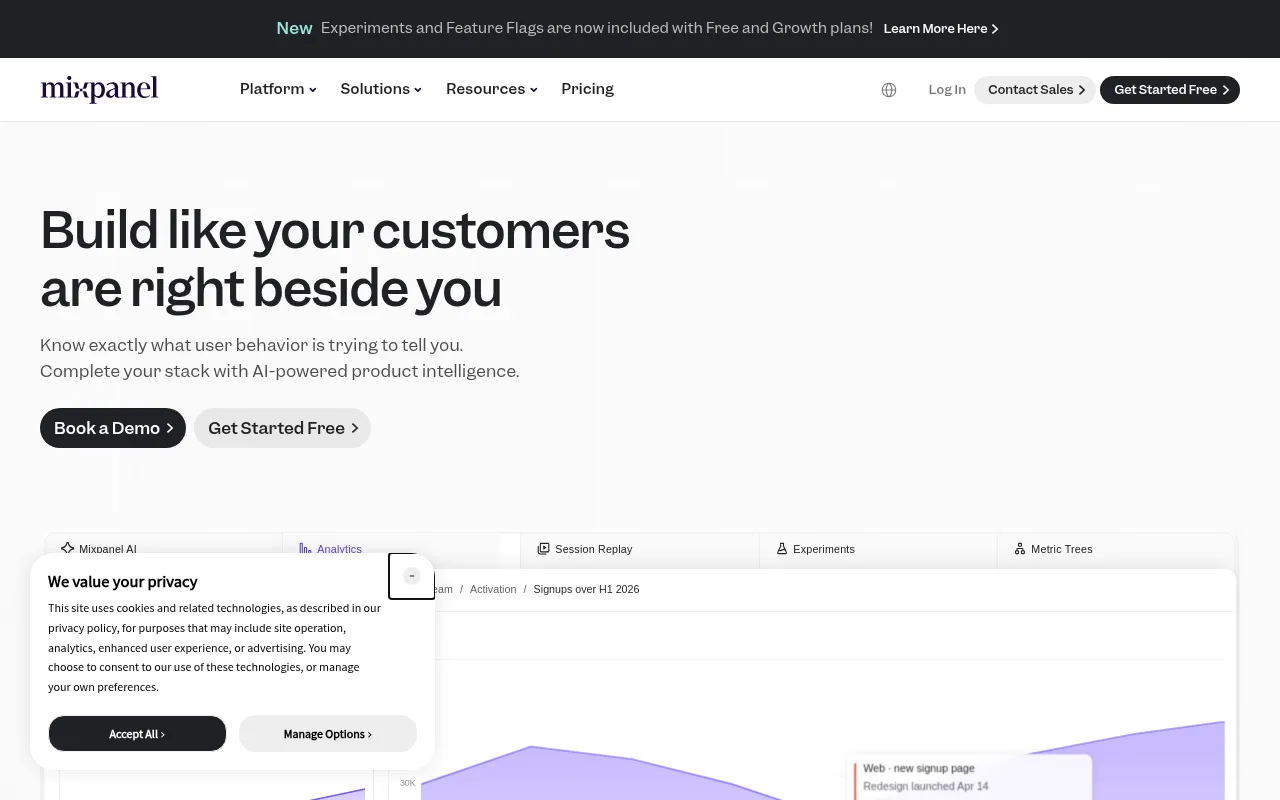
Mixpanel
Event-based product analytics platform built around fast, self-serve funnel and retention analysis.
Strengths
- +Most generous free tier of any tool tested (20M events/month)
- +Fastest tool to get a first funnel or retention report live without a data team
- +Clean, approachable UI that non-technical PMs can use directly
Weaknesses
- -Session replay and experimentation feel newer and less mature than dedicated tools
- -Less depth for engineering-led teams wanting self-hosted or warehouse-native data
Heads up: Mixpanel's free tier is genuinely generous, but once you outgrow it, per-tracked-user pricing at scale can get expensive faster than event-based competitors - model your growth curve before committing to a paid tier.
Free tier covers up to 20 million events per month, the most generous of any tool tested; paid Growth plans start around $28/month and scale with tracked users, with custom pricing at higher volumes.
Visit Mixpanel →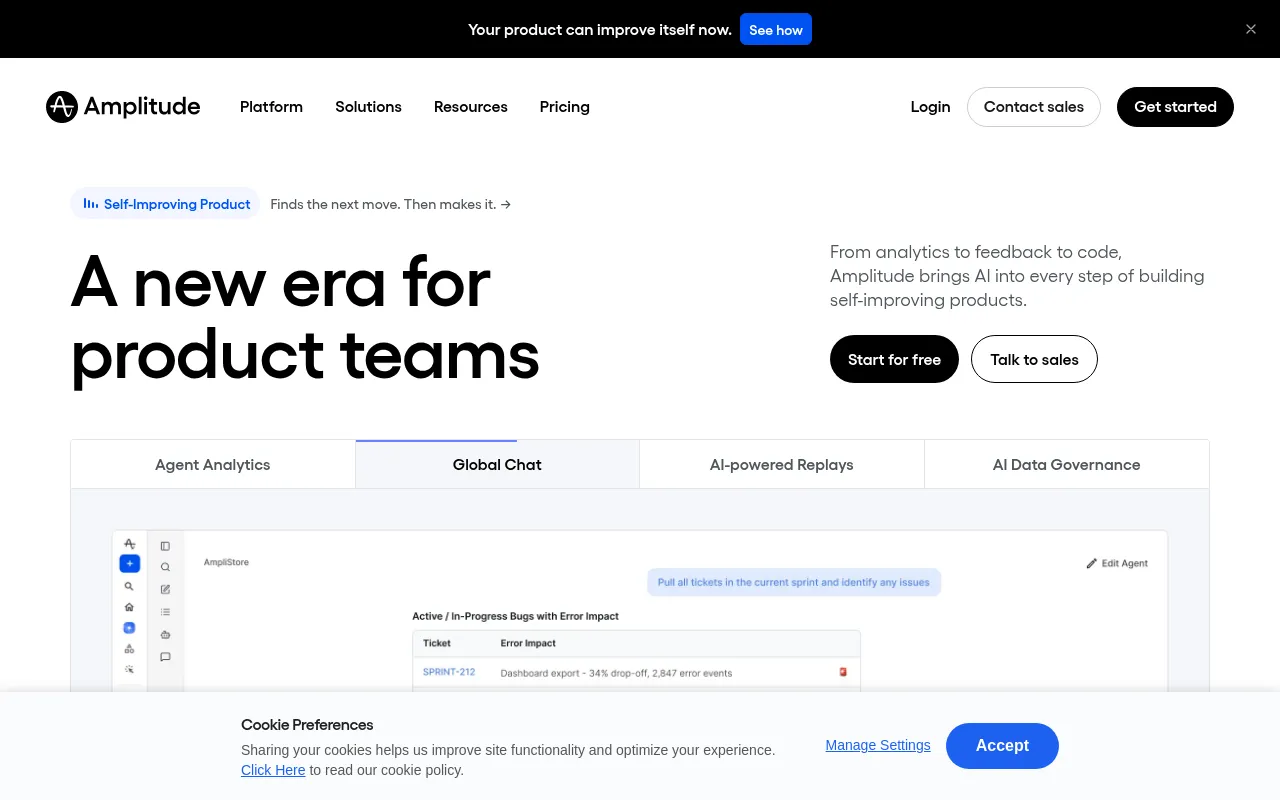
Amplitude
Enterprise product intelligence platform unifying behavioral analytics, experimentation, and a customer data platform.
Strengths
- +Deepest funnel, retention, and cohort analysis of any tool tested
- +Mature, enterprise-grade experimentation (A/B testing) suite
- +Unifies analytics with a customer data platform (CDP), reducing the need for a separate tool
Weaknesses
- -No public pricing beyond the free tier - every paid plan requires a sales call
- -Session replay is a newer addition, less mature than dedicated replay tools
Heads up: Amplitude's paid pricing isn't published anywhere on its site. Budget time for a sales conversation before you can put a real number next to this option - that alone rules it out for teams that need to self-serve a decision quickly.
Free plan covers up to 50,000 monthly tracked users; beyond that, Amplitude requires a custom sales quote rather than published self-serve pricing, which makes it harder to estimate cost before talking to sales.
Visit Amplitude →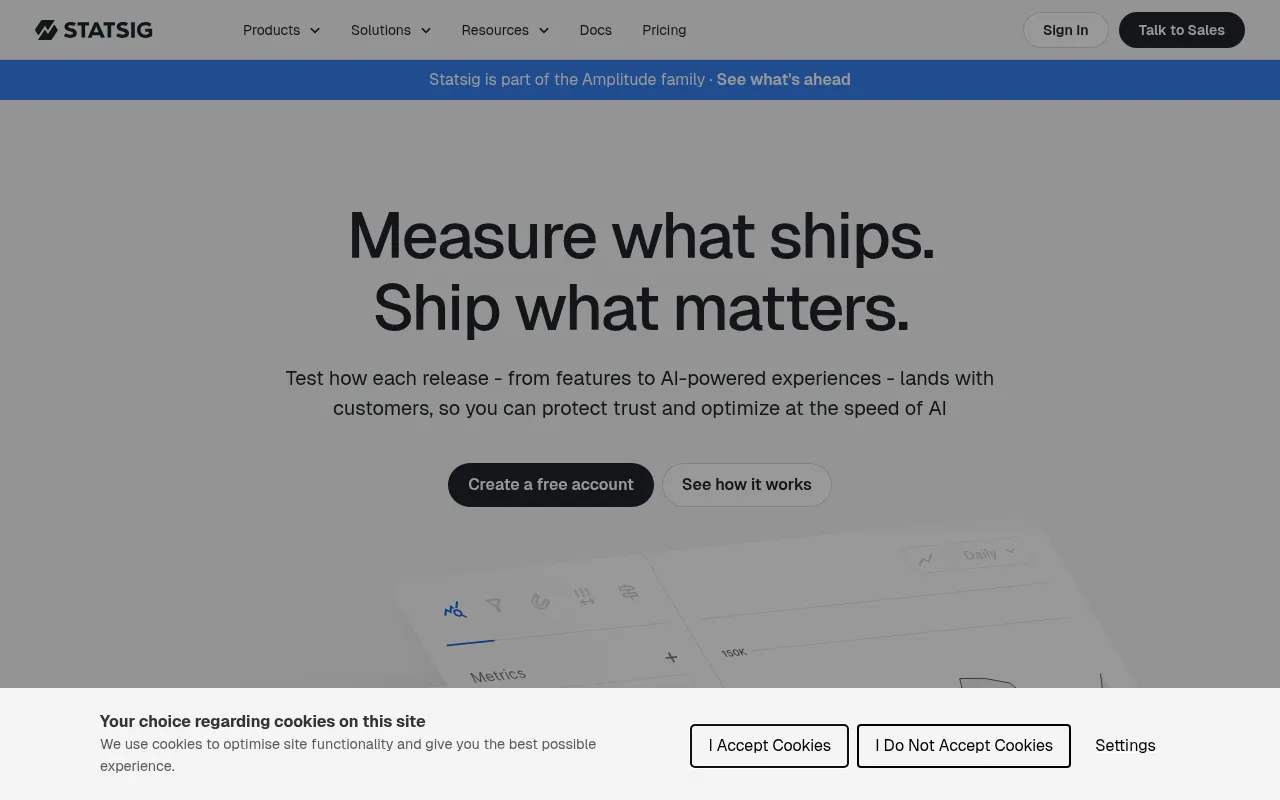
Statsig
Experimentation-first analytics platform built around feature flags and statistically rigorous A/B testing, with product analytics included.
Strengths
- +Most statistically rigorous experimentation platform tested, built by a team with deep experimentation infrastructure experience
- +Transparent, self-serve pricing with a genuinely generous free tier
- +Warehouse-native data options for engineering-led teams
Weaknesses
- -No native session replay - a real gap if qualitative insight matters to your workflow
- -Less mature standalone funnel/retention UI than analytics-first tools like Amplitude or Mixpanel
Heads up: Statsig is built experimentation-first, analytics second. If session replay or deep funnel exploration is your primary need rather than running rigorous A/B tests, a different tool in this benchmark will serve you better.
A generous free tier covers most early-stage usage; paid usage is metered and priced transparently on a public calculator, similar in spirit to PostHog's approach.
Visit Statsig →
Heap
Auto-capture product analytics tool that records every user interaction automatically, no manual event instrumentation required.
Strengths
- +Best automatic event capture tested - tracks every click and interaction with zero manual setup
- +Retroactive analysis - you can build a report on data captured before you defined the event
- +Solid built-in session replay
Weaknesses
- -Pricing is entirely quote-based, with no published tiers to compare against competitors
- -Feature flags and experimentation are limited to nonexistent compared to dedicated tools
Heads up: Heap's auto-capture is genuinely convenient, but it also means you're storing a lot of data you'll never use, which is part of why pricing is quote-based and volume-sensitive - confirm your expected event volume before assuming the free plan covers you.
A limited free plan exists, but real usage requires a paid plan, and Heap doesn't publish pricing - you'll need to request a quote, which varies significantly by data volume and seat count.
Visit Heap →
Hotjar
Budget-friendly heatmap and session recording tool built primarily for understanding website visitor behavior.
Strengths
- +Easiest, fastest setup of any tool tested for basic heatmaps and recordings
- +Clear, published pricing with a real free tier
Weaknesses
- -Shallow funnel and retention analysis compared to dedicated product analytics tools
- -Little to no native experimentation or feature-flag support
Heads up: Hotjar is built for understanding website behavior (heatmaps, recordings, surveys), not deep in-product funnel and retention analysis. If that's your core need, expect to pair it with or replace it with a dedicated product analytics tool.
A genuinely usable free tier exists for low traffic; paid plans start around $32/month and scale with page views, among the more transparently priced tools tested.
Visit Hotjar →
Pendo
Product-led growth platform combining analytics with in-app guides, onboarding flows, and NPS surveys.
Strengths
- +Best-in-class in-app guides and onboarding flow builder, not just analytics
- +NPS and in-app survey tooling built directly into the same product
- +Strong for product-led growth teams that need to act on data, not just view it
Weaknesses
- -Pricing is quote-based and has a reputation for running expensive relative to analytics-only competitors
- -Core analytics depth (funnels, retention, cohorts) trails dedicated analytics-first tools
Heads up: Pendo bundles analytics with in-app guide-building, which is genuinely useful if you need both - but you're paying for the guide builder even if you only want the analytics, and pricing has a reputation for running high. Confirm the quote covers only what you'll actually use.
A free plan exists but is capped tightly enough that most real usage requires a paid plan, and Pendo doesn't publish pricing beyond that - expect a sales conversation, with pricing that historically runs higher than pure analytics competitors.
Visit Pendo →
FullStory
Digital experience analytics platform built around best-in-class session replay and heatmaps, with product analytics layered on top.
Strengths
- +Best session replay and heatmap quality of any tool tested, its original core strength
- +Automatic search and rage-click detection across recorded sessions, not just manual review
Weaknesses
- -Weak native experimentation and feature-flag support compared to dedicated tools
- -Pricing is entirely quote-based with no published tiers to compare
Heads up: FullStory's session replay is genuinely best-in-class, but if you need feature flags or A/B testing in the same product, you'll be reaching for a second tool - it isn't built for that.
A limited free plan exists for low-volume sites; real usage requires a paid plan, and FullStory doesn't publish pricing beyond that - expect a sales quote based on session volume.
Visit FullStory →Feature comparison matrix
Google Analytics 4 included for reference, alongside every alternative.
| Feature | PostHog | Mixpanel | Amplitude | Statsig | Heap | Hotjar | Google Analytics 4 | Pendo | FullStory |
|---|---|---|---|---|---|---|---|---|---|
| Native session replay | Yes | Partial (add-on) | Partial (newer) | No | Yes | Yes | No | Yes | Yes |
| Feature flags built in | Yes | Partial | Partial (separate module) | Yes | No | No | No | Partial | No |
| Native A/B testing / experimentation | Yes | Partial | Yes | Yes | No | No | Partial | Partial | Partial |
| Auto-capture (no manual event coding required) | Yes | Partial | Partial | Partial | Yes | Yes | Partial | Partial | Yes |
| Published self-serve pricing | Yes | Yes | No (quote beyond free tier) | Yes | No | Yes | Yes (free) | No | No |
| Self-hosting option | Yes | No | No | No | No | No | No | No | No |
| Free tier | Yes (1M events/mo) | Yes (20M events/mo) | Yes (50K MTUs) | Yes (generous) | Limited | Yes | Yes (no real cap) | Limited | Limited |
| In-app guides / onboarding flows | No | No | No | No | No | No | No | Yes | No |
| Data warehouse export | Yes | Yes (paid) | Yes (paid) | Yes | Yes (paid) | Yes (paid) | Yes (free, BigQuery) | Yes (paid) | Yes (paid) |
| Starting price (paid) | Usage-based, from ~$0 | $28/mo | Custom quote | Usage-based, generous free tier | Custom quote | $32/mo | Free | Custom quote | Custom quote |
Frequently Asked Questions
What's the best alternative to Google Analytics 4?
PostHog, based on our benchmark - it scored 56/60 against Google Analytics 4's 36/60 across Event Tracking & Setup Simplicity, Funnel & Retention Analysis Depth, Session Replay & Qualitative Insight, Experimentation & Feature Flags, Pricing Transparency & Cost at Scale, Data Ownership & Warehouse Export.
Why do people switch away from Google Analytics 4?
GA4 is free and easy to install, but it was built for marketing/traffic analytics, not product analytics. If you need to understand in-app user behavior instead of where your visitors came from, expect to outgrow it quickly.
Is PostHog cheaper than Google Analytics 4?
PostHog's Free up to 1 million events per month on the hosted cloud plan (unlimited on self-hosted); paid usage is metered per product - analytics, replay, flags, experiments - rather than one bundled seat price, so cost scales with how many of its tools you actually turn on. Google Analytics 4's pricing: The standard product is free with no realistic volume ceiling for most sites; the enterprise tier, GA360, adds higher processing limits and support but requires a custom sales quote.
Can I switch from Google Analytics 4 to PostHog without losing my work?
That depends on what each tool lets you export - check the feature comparison matrix on this page for each tool's export and data-portability support before committing to a switch. It's rarely a one-click transplant, so budget time to rebuild anything that doesn't have a direct import path.
About the writer
Jake Sullivan
Senior Content Researcher
Jake runs the majority of Benchmark Lab's hands-on testing - executing the identical test script across every tool in a category, logging what succeeded, what failed, and how long each step took. He writes up the results for the categories and comparisons he tests directly.
Read more →